Corrective Action vs Preventive Action vs Defect Repair

Corrective Action Vs Preventive Action Vs Defect Repair

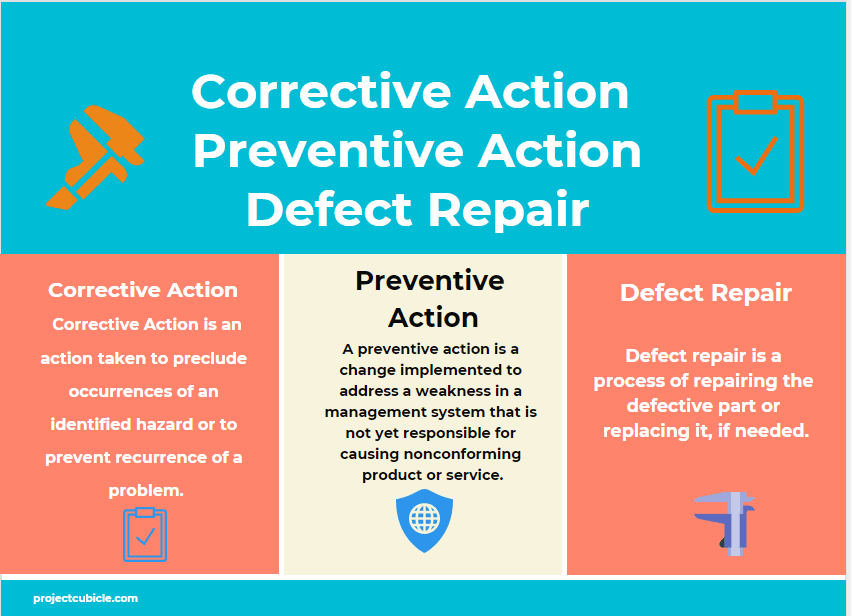
In the Quality Management System, corrective action eliminates the cause of nonconformity after problems arise. Preventive actions focus on eliminating the causes of potential nonconformities before problems arise. On the other hand, defect repair is a repairing process to replace … Read more

Pareto Chart (Pareto Analysis) in Quality Management

Pareto Chart Pareto Analysis How To Read A Pareto Chart Infographic

There are many tools, techniques, diagrams, and charts are used in quality management to make analysis and improve the process quality. Pareto Chart (also known as Pareto Analysis or Pareto Diagram) is one of the seven basic tools of quality … Read more

5s Methodology & Principles in Project Management

What Does The 5S Stand For? 5S Methodology 5S Principles In The Workplace Infographic

Organizations often try to change their production system to achieve more work using fewer resources. In order to increase the profit by reducing waste and costs, a business must become more productive than before considering the rapidly changing economic conditions. … Read more

Common Cause Variation vs Special Cause Variation

Common Cause Variation Vs Special Cause Variation

What are the causes of variation in quality control or what are the types of variation? The term “variation” is widely used in statistics, quality management, genetics, and even in biology. It refers to the measurement for a group of … Read more

Kaizen Methodology for Process Improvement

Kaizen Methodology Kaizen Implementation Infographic

Productivity is very important in today’s competitive business environment. Organizations seek ways of improving their processes, reducing costs and increasing their benefits. Kaizen is a management system that aims continuous improvement within all processes of an organization. It has similarities … Read more

Fishbone Diagram (Cause and Effect Diagram)

Fishbone Diagram (Cause And Effect Diagram) Ishikawa Diagram

Fishbone diagram , also known as cause and effect diagram or Ishikawa diagram is a quality management tool that is commonly used to identify the root cause of a problem. Basically, it analyzes various possible causes of a problem with … Read more

Analyzing Data Dynamics: Control Chart versus Run Chart

Control Chart Versus Run Chart In Quality Control Infographic

If you are preparing for the PMP Certification exam, most probably you asked the following questions yourself – What are the similarities and differences between control and run charts? and Why are they so important for process control? Basically, Control … Read more