Primavera P6 Activity Relationships Explained

Figure 6-Columns Added

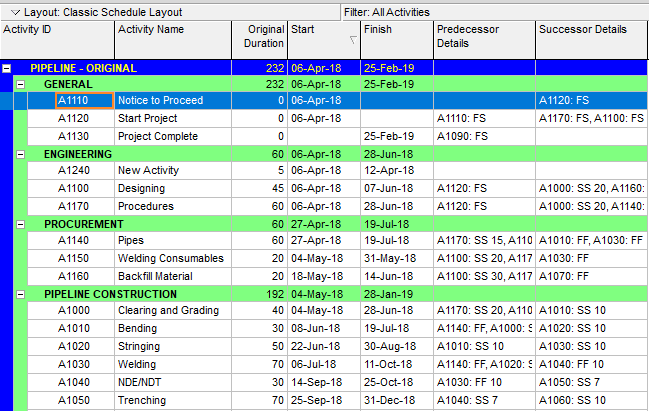
A project work schedule is a project document that represents all the milestones, activities, tasks, and activity dependencies required to complete the project on time. Before creating a work schedule, all the tasks are listed and grouped under specific work … Read more

Waterfall Model & Waterfall Methodology

Advantages And Disadvantages Of Waterfall Model And Methodology For Software Design And Development &Amp; Waterfall Model Diagram Infographic

The Waterfall Model is a sequential and linear diagram for software design and development processes. Typically, sequential phases (Requirements, Design, Implementation, Testing, Delivery, Maintenance) form a waterfall diagram and each phase is completed before the next phase begins. This model … Read more

Portfolio Management, Program and Project Management

Project Management Program Management Portfolio Management Infographic

Project Management, Program Management, and Portfolio Management are very important terms in project scope management. Although they sound similar, they refer to different concepts. Many PMP aspirants don’t know the differences between them. Knowing these concepts and understanding their differences … Read more

Conflict Management Techniques in Project Management

Conflict Management Techniques In The Workplace Conflict Resolution Techniques

In this article, we will discuss conflict management techniques in the workplace and their importance for successful project management. Conflicts are integral parts of our daily lives. They may arise when two or more people do not agree on an … Read more

Work Breakdown Structure Example | What is WBS?

Work Breakdown Structure

How to Create a Work Breakdown Structure? The concept, Work Breakdown Structure is widely used by professionals to represent the project’s scope and deliverables in a hierarchical way. Typically, creating a WBS is one of the first steps in project … Read more

Pareto Chart (Pareto Analysis) in Quality Management

Pareto Chart Pareto Analysis How To Read A Pareto Chart Infographic

There are many tools, techniques, diagrams, and charts are used in quality management to make analysis and improve the process quality. Pareto Chart (also known as Pareto Analysis or Pareto Diagram) is one of the seven basic tools of quality … Read more

Kaizen Methodology for Process Improvement

Kaizen Methodology Kaizen Implementation Infographic

Productivity is very important in today’s competitive business environment. Organizations seek ways of improving their processes, reducing costs and increasing their benefits. Kaizen is a management system that aims continuous improvement within all processes of an organization. It has similarities … Read more

Critical Path Method (CPM) in Project Management

Critical Path Method (Cpm) In Project Management

The critical path method (CPM) is a fundamental concept in project planning and management. It is a useful technique used for scheduling project activities like PERT method. The critical path of a schedule demonstrates the activities that can not be … Read more