
The Compound Annual Growth Rate (CAGR) is a valuable metric used to measure the annual growth rate of an investment over a specified period, considering the effect of compounding. Excel provides a straightforward method for calculating CAGR using a predefined formula. Let’s explore how to utilize the CAGR formula in Excel:
Table of Contents
CAGR Formula in Excel: Understanding the Difference Between CAGR and XIRR
When evaluating investments or analyzing financial data in Excel, two common metrics used for measuring growth or returns are Compound Annual Growth Rate (CAGR) and Extended Internal Rate of Return (XIRR). While both metrics serve similar purposes, they have distinct characteristics and applications. Let’s delve into the differences between CAGR and XIRR:
1. Compound Annual Growth Rate (CAGR):
- Definition: CAGR is a measure of the annual growth rate of an investment over a specified period, considering the effect of compounding.
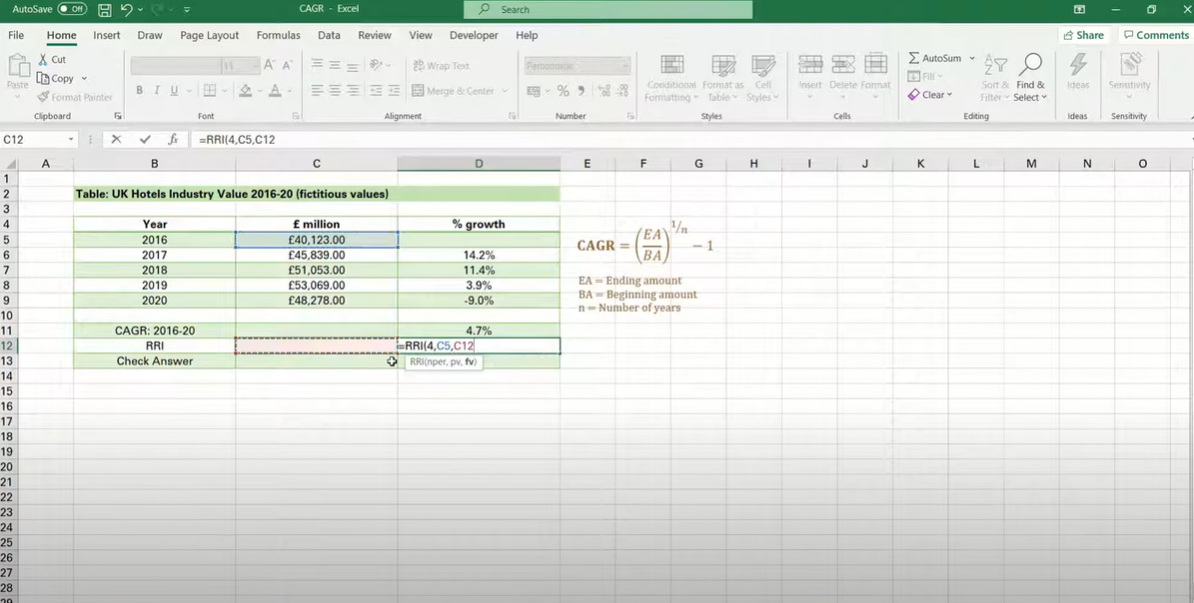
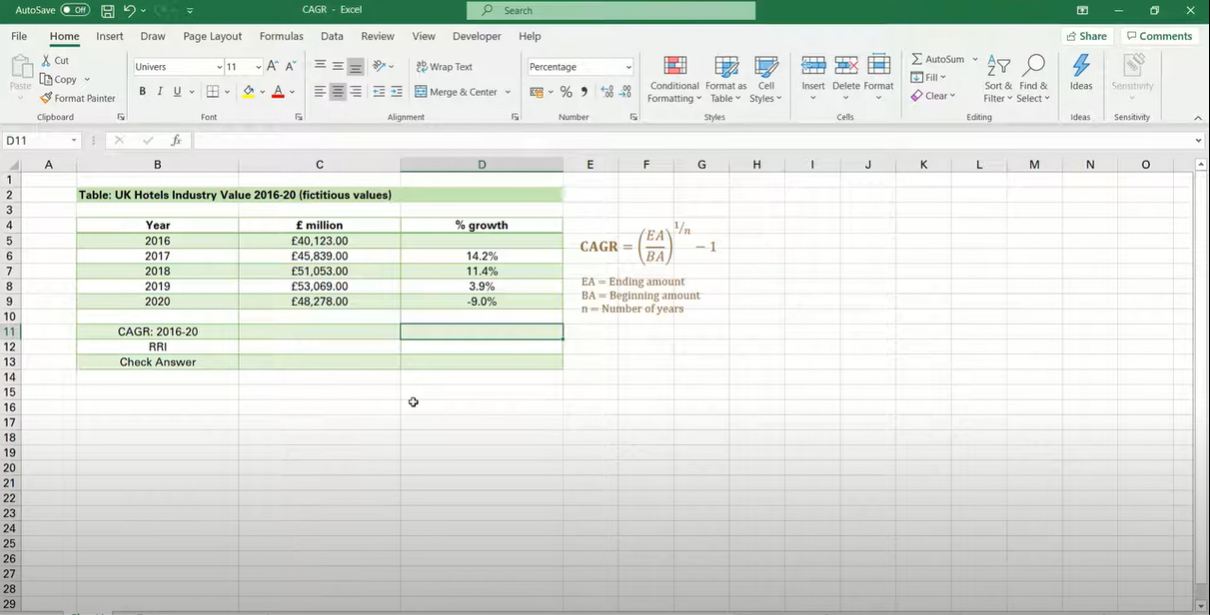
- Calculation: CAGR is calculated using the formula:
excel=((Ending Value / Beginning Value)^(1 / Number of Years)) - 1
- Usage: CAGR is typically used to evaluate the historical performance of investments with regular intervals, such as stocks, mutual funds, or business metrics, over a fixed period.
2. Extended Internal Rate of Return (XIRR):
- Definition: XIRR is a metric used to calculate the annualized return rate of an investment with irregular cash flows over different periods.
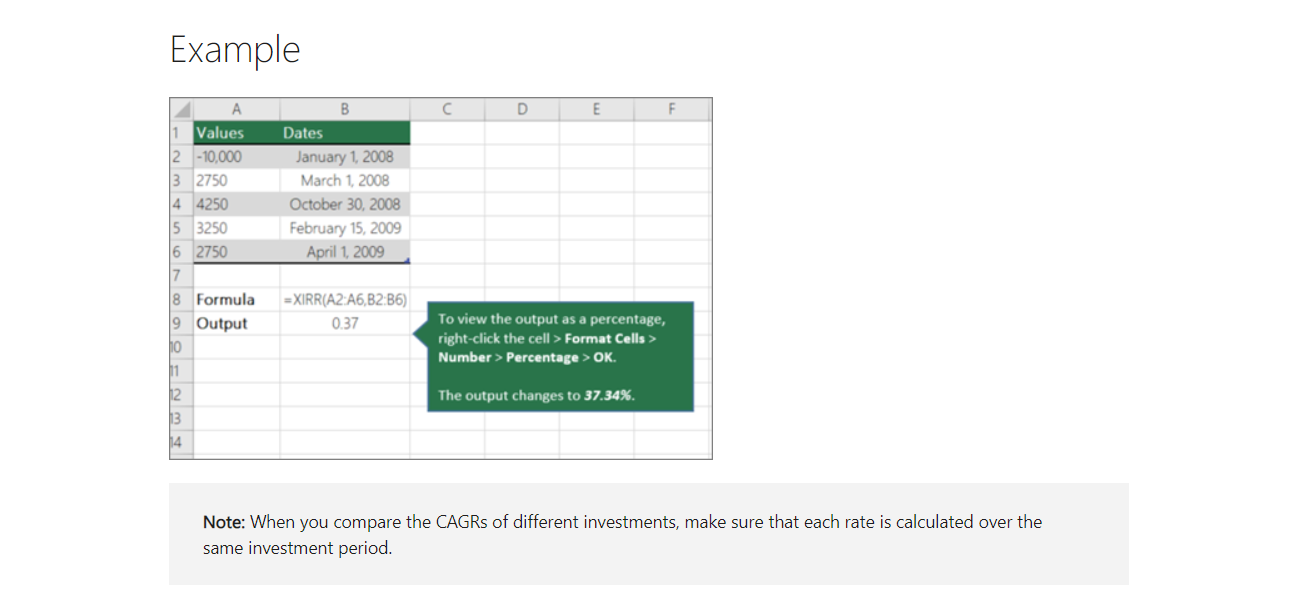
- Calculation: XIRR is calculated using the XIRR function in Excel, which takes into account the dates and amounts of cash flows.
excel=XIRR(values, dates, [guess])
- Usage: XIRR is commonly employed when analyzing investments with non-uniform cash flows, such as loans, bonds, or investment portfolios with periodic contributions or withdrawals.
Key Differences:
- Regular vs. Irregular Cash Flows: CAGR assumes regular intervals for cash flows, making it suitable for investments with consistent growth patterns. In contrast, XIRR accommodates irregular cash flows, making it applicable to investments with varying contributions or withdrawals over time.
- Period of Analysis: CAGR typically measures growth over a fixed period, such as years. In contrast, XIRR calculates the annualized return rate considering the entire duration of investment, accounting for the timing and magnitude of cash flows.
- Application: While CAGR is widely used for evaluating historical performance and comparing investment options with regular intervals, XIRR is preferred for analyzing investments with complex cash flow structures or irregular contribution patterns.
Conclusion:
In summary, while both CAGR and XIRR are valuable metrics for evaluating investments and financial data in Excel, they serve different purposes and are applied in distinct scenarios. Understanding the differences between CAGR and XIRR is essential for accurately assessing investment performance and making informed financial decisions. Whether analyzing stocks, bonds, or investment portfolios, choosing the appropriate metric based on the nature of the investment is crucial for meaningful analysis and decision-making.

A dedicated Career Coach, Agile Trainer and certified Senior Portfolio and Project Management Professional and writer holding a bachelor’s degree in Structural Engineering and over 20 years of professional experience in Professional Development / Career Coaching, Portfolio/Program/Project Management, Construction Management, and Business Development. She is the Content Manager of ProjectCubicle.


