
If you deal with statistics everyday, you should learn how to find correlation coefficient in excel. Because in finance or even in academia, correlation coefficient is a common and core statistical value for diverse studies.
Table of Contents
Anyone dealing with data analysis, statistics or business insights needs to know how to get the correlation coefficient in Excel. Because it facilitates your understanding of the connection between two data sets.
how to find correlation coefficient in excel
The CORREL function in Excel calculates the correlation coefficient between two sets of data. The correlation coefficient is a value between -1 and 1. And it represents the strength and direction of the relationship between two variables. A correlation coefficient of -1 states a perfect negative correlation. While a correlation coefficient of 0 indicates no correlation. And a correlation coefficient of 1 means a perfect positive correlation.
How to Use the CORREL Excel Function
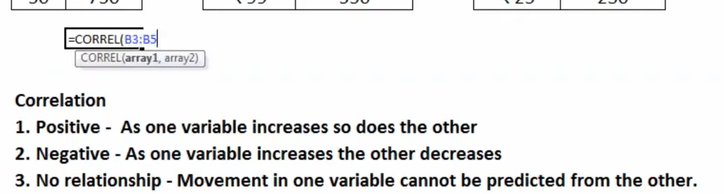
Using the CORREL function in Excel is simple tough. First, you will select the cell where you want the correlation coefficient to appear. Then, you can type “=CORREL(” followed by the two ranges of data you want to correlate. And you will separate them by a comma. Finally, you will close the parentheses and press enter.
how to use excel correlation function
For example, if you have two sets of data in cells A1:A10 and B1:B10. If you want to calculate the correlation coefficient between them, you would type “=CORREL(A1:A10,B1:B10)” in the cell where you need the want the coefficient.
It is important to note that the CORREL function in Excel only calculates the correlation between two data sets. If you have more than two sets of data, you must use the function multiple times to calculate correlations between each set.
Interpreting the Results of correl function excel
As previously mentioned, the correlation coefficient is between -1 and 1. This is basically representing the power and direction of the relationship between two variables. However, interpreting the results of the CORREL function in Excel can be tricky.
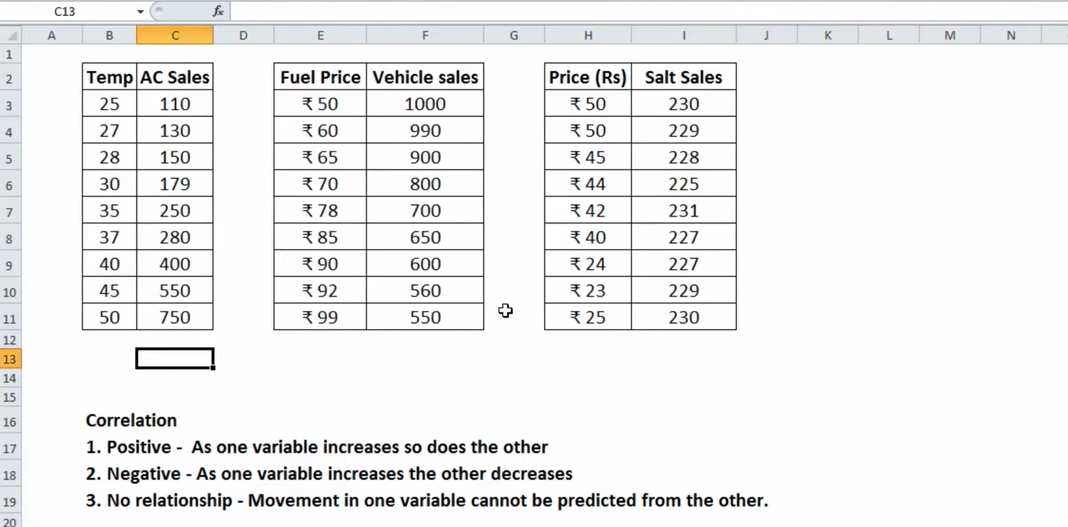
If the correlation coefficient is positive, it means a positive relationship between the two variables. This means that as one variable increases, the other tends to increase. The closer the coefficient is to 1, the stronger the positive relationship tough.
how to calculate correlation coefficient in excel
If the correlation coefficient is negative, it states a negative relationship between the two variables. This means while one variable increases, the other variable will possibly decrease. The closer the coefficient is to -1, the negative relationship will get stronger.
If the correlation coefficient is close to 0, it indicates no relationship between those two variables.
But here, correlation does not imply causation. So, in case two variables are correlated, it does not mean one causes the other.
Common Errors When Using excel correl function
There are a few common errors that people make when using the CORREL function in Excel.
- The first error is using non-numeric data. The CORREL function can only work with numeric data as we already know from above tips. So if you have any non-numeric data in your ranges, you must remove it before using the function. Or you can try text to number conversions in Excel.
- The second error is using ranges of different sizes. The CORREL function needs both ranges be the same size. In case they are not, you will need to adjust the ranges before writing correl function at first.
- Finally, you should select your cell ranges properly. If you include or exclude cells from the ranges even by accident, the results will be incorrect.
Conclusion
Hence, we can say CORREL Excel function works for calculating the correlation coefficient between two data sets. If you get better at how to use the function and interpret the results, you can calculate the relationships between variables in your data.
We hope you get CORREL function in Excel for your future studies. If you have any further questions or want to learn more about Excel functions, please explore our other guides.
correlation in excel
When optimizing your Excel skills and data analysis techniques, the CORREL function is just the beginning. Some many other functions and tools can help you for statistical analysis in different areas of academia. Even in sociology to engineering departments. If you take time to learn and practice these techniques, you can become a better data analyst.
Important considerations with the CORREL Function
- #N/A error: This happens when the arrays have varying lengths. Therefore, CORREL will return the #N/A error value if Array1 and Array2 contain differing numbers of data points.
- If one of the provided arrays is empty or if the standard deviation of its values is zero, the #DIV/0 error pops up.
- Cells with the value zero in an array or reference argument. But values that include text, logical values or empty cells are disregarded.
- The PEARSON function may show minor rounding mistakes in previous Excel versions before to 2003. But otherwise, the CORREL function is identical to the PEARSON function. Therefore, using the CORREL function in previous Excel versions will be a good choice. Both functions will give identical outcomes tough.
Extra Tip:How to Use PEARSON Function
An alternate method for determining the correlation coefficient in Excel is PEARSON function.
It closely resembles the CORREL function tough. But the PEARSON function has the following syntax:
=PEARSON(array1,array2) array1 : array of variable x array2: array of variable y
If you wanna insert array1 and array2, you will just select the cell range for both.
You can check out our most valuable resources regarding Excel.

A dedicated Career Coach, Agile Trainer and certified Senior Portfolio and Project Management Professional and writer holding a bachelor’s degree in Structural Engineering and over 20 years of professional experience in Professional Development / Career Coaching, Portfolio/Program/Project Management, Construction Management, and Business Development. She is the Content Manager of ProjectCubicle.


