
Today, Excel is a great tool for businesses, professionals and students as well. It offers way too many functionalities. And one such powerful feature is Power View for Excel. So here, we will explore the capabilities of Power View for Excel in detail. 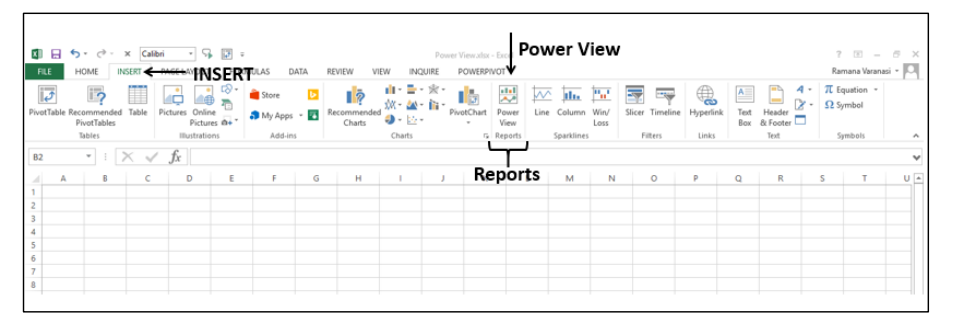
Table of Contents
Power View for Excel
Understanding Power View: How to get Power View in Excel?
Power View in Excel is a data visualization tool. And with it, we can create interactive reports, presentations and dashboards directly. So that we can transform raw data into interesting visualizations for storytelling. With Power View, we can easily navigate through data, filter information and drill down into specific details as well.
What is a Power View sheet in Excel?
If you wanna access Power View in Excel, you need to have a compatible version for it. Sch as Excel 2013 or later. Also, you need to ensure Power View add-in is on. If it is on, you can start creating Power View reports by importing data from your own sources. Or you can use existing Excel tables. With its easy user interface, Power View come with different visualization options. These are including charts, tables, matrices and maps.
Creating Interactive Dashboards
So, Power View can create interactive dashboards to visualize multiple datasets and explore them dynamically. By combining different visual elements, such as charts, slicers and filters, all level of users can create a rich and interactive experience. With just a few clicks, you can create presentations as well.
Visualizing Data Trends: Is Power View available in Excel 365?
Power View excels in visualizing data trends over time. You can transform sales figures, stock prices or website traffic into great visual elements. Also if you apply animated transitions and interactive elements, users can present data in a more engaging manner for everyone. And audience can be teachers or your managers and customers.
Exploring Geographic Data
Geographic data is a component of many business analyses. Power View provides mapping capabilities. This option actually means having visually stunning maps. And they represent data based on geographical regions. For example, you can show sales by region, customer distribution or market penetration.
Analyzing Sales Performance
For businesses, understanding sales performance is a big issue when it comes to strategic decisions. Power View offers has visualization tools to analyze sales data as well. Since you can create interactive charts, filtered views and reports, you can show sales data from multiple angles.
Enhancing Data Exploration
Power View goes beyond traditional static charts and tables actually. Because here, you can quickly change chart types, switch dimensions and apply filters. With Power View, the exploration of data becomes an interactive and engaging experience for every user.
The Power of Data Visualization: Power View Excel download
Enhancing Understanding with Visuals
Humans are visual creatures and our brains process visual information in a better way. Data visualization has its inherent ability to grasp complex concepts. Hence, Power View takes data visualization to the next level to tell information in interactive ways.
Looking for Trends and Patterns
Power View simplifies the process of finding common or differentiating points. Since we, users can transform data into different charts and other visuals.
Interactive Exploration
Good news is Power View has a quite interactive nature. So we can easily filter, sort and play with our data from different perspectives. With just a few clicks, you can slice and dice your data.
How to get Power View in Excel?
So Power View is available in Excel 2013 and in other recent versions. If you are using an earlier version, you should install the necessary add-in manually. After, you can find the Power View button in Insert tab.
Importing Data Power View for Excel
If you wanna create visualizations in Power View for Excel, you need to import your data into Excel. You can import data from various sources such as Excel spreadsheets, SQL databases and online data sources. Excel has an easy data import wizards. And it will guide you through the process.
Designing Visualizations
After you import your data, you can start designing visualizations using Power View. With Power View, you have many more visualization options at your disposal. These are including charts, maps, tables and matrices. You can choose the appropriate visualization type for your taste. Power View also can customize the appearance of your visualizations. These option are colors, fonts and labels.
Benefits of Microsoft Power View for Excel Download
1. Enhanced Data Analysis
Power View has a rich set of visualization options. Because here we have options like interactive filters, sorting and highlighting. So even if you are not super good with numbers or excel formulas, this view can help you along the way.
2. Engaging Presentations
Showing boring numbers or lists in way more cool shapes or graphs is key to keeping attention of your audience. Power View means we have dynamic presentations. So that, you can encourage exploration and interaction within your audience. When you have interactive visuals and slicers in your presentations, people can understand what you mean by themselves.
3. Integration with Excel Formulas
Since it belongs to Microsoft Excel suite, Power View integrates with other Excel features too. You can use this view along with Excel formulas and pivot tables. Also, this integration is meaning you can work with your data at the fullest capacity.
4. Collaboration and Sharing Options
With this view, you can also share your reports and presentations with other team mates or your clients. You can save your Power View reports as Excel workbooks. Or you can publish them to SharePoint for broader access. Also, this option gives us collaboration chance within your team. Note to mention, you can export your Power View visuals as static images or PowerPoint slides if you wanna use them in other places.
Conclusion on Power View for Excel
Power View for Excel is a great and advanced tool for telling data conclusions. With this, we can create interactive reports and dashboards each manager or customer strives for.
Project Cubicle Recommends

A dedicated Career Coach, Agile Trainer and certified Senior Portfolio and Project Management Professional and writer holding a bachelor’s degree in Structural Engineering and over 20 years of professional experience in Professional Development / Career Coaching, Portfolio/Program/Project Management, Construction Management, and Business Development. She is the Content Manager of ProjectCubicle.


