Mastering Contour Plots in Excel: A Comprehensive Guide
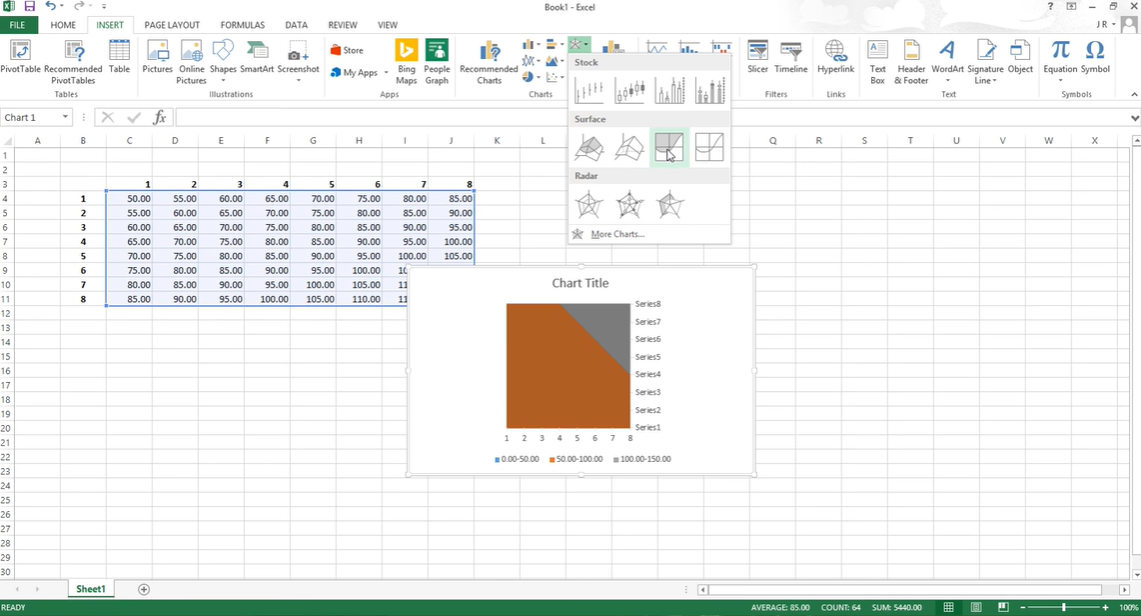
Contour plots in Excel are quite good way to visualize 3-dimensional data in a 2-dimensional space. They see how a particular variable changes across two dimensions. With the third dimension represented by contour lines or colors. But contour plots may … Read more