

How to calculate p value in an Excel z-test? In the realm of statistical analysis, understanding how to perform a Z-Test in Excel is a vital skill for both students and professionals alike. Excel, with its comprehensive suite of tools for data analysis, simplifies conducting statistical tests, including the Z-Test. This test is commonly used to determine if there is a significant difference between the means of two groups, which is particularly useful in various fields such as marketing, finance, and research. In this article, we will delve into the nuances of performing a Z-Test in Excel, offering detailed insights and examples to ensure you can apply this statistical method with confidence.
Table of Contents
Understanding the Z-Test
What Is a Z-Test?
The Z-Test is a statistical test used to determine whether there are significant differences between the means of two datasets or if a sample mean significantly deviates from a population mean. It operates under the assumption of a known population variance and follows a normal distribution, making it a powerful tool for hypothesis testing.
When to Use a Z-Test
Utilize a Z-Test in Excel when you have large sample sizes (n > 30), known population variances, and when the data follows a normal distribution. It’s ideal for comparing sample and population means or the means of two independent samples.
Performing a Z-Test in Excel
Preparing Your Data
Before executing a Z-Test, ensure your data is clean and organized. Typically, you should have two sets of data: either two samples for comparing means or one sample and a population mean. Organize your data in two columns if comparing samples for easy analysis.
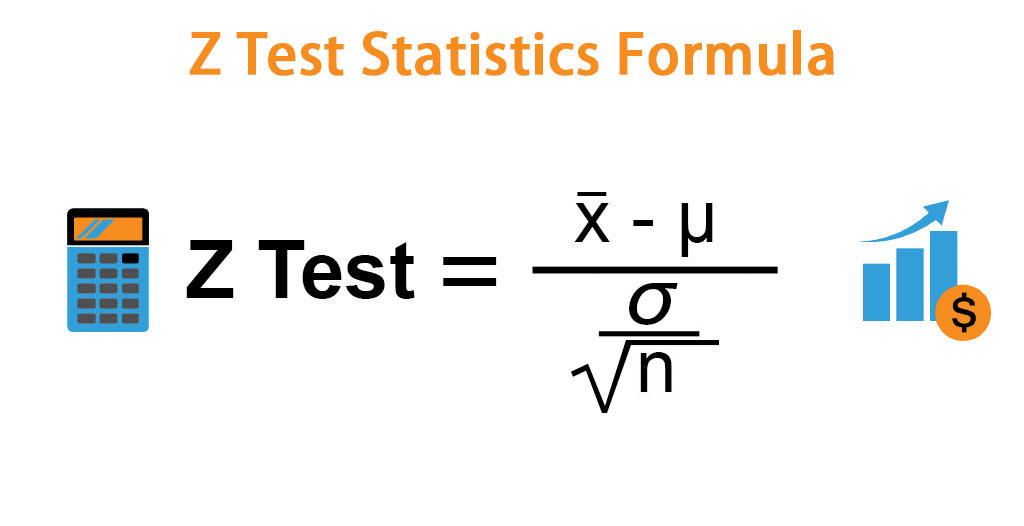
Calculating the Z-Test Statistic
Excel does not have a built-in function specifically for Z-Tests, but you can calculate the Z-Test statistic using the formula:
Step-by-Step Guide to Z-Test in Excel
- Input Your Data: Enter your data into two columns if comparing samples or one column for a sample versus a population mean.
- Calculate Means and Standard Deviations: Use Excel’s
AVERAGEandSTDEV.Sfunctions for sample statistics orSTDEV.Pfor population parameters. - Compute the Z-Test Statistic: Apply the Z-Test formula using the calculated means, standard deviations, and sample size.
- Determine the Critical Value: Use standard Z-tables or Excel’s
NORM.S.INVfunction to find the critical value for your significance level. - Compare Z-Test Statistic to Critical Value: Determine whether to reject the null hypothesis by comparing the Z-Test statistic to the critical value.
- Interpret the Results: Analyze the results to understand the statistical significance of the data.
- Document Your Findings: Summarize the analysis, including the setup, computation, and interpretation of the Z-Test in Excel.
How to Calculate P Value in Excel Z-Test?
Examples of Z-Test in Excel
- Comparing Sample Means: For instance, analyzing the effectiveness of two marketing campaigns by comparing the average customer responses.
- Sample Mean vs. Population Mean: Assessing if a class’s average test score significantly differs from the national average.
Let’s create a simple example of a Z-test in Excel to compare the mean of a sample to a known population mean. This example will guide you through setting up your data, calculating the Z-test statistic, and interpreting the results. For this example, let’s say we want to determine if the average test score of a sample of 30 students is significantly different from the known population mean test score of 70 points. Assume the population standard deviation (σ) is known to be 10 points.
Step 1: Set Up Your Data in Excel
First, enter your sample data in Excel. Let’s say the test scores of the 30 students (sample) are entered in cells A2 through A31. In cell B1, type “Population Mean” and enter the value 70 in cell B2. In cell C1, type “Population Std Dev” and enter the value 10 in cell C2.
Step 2: Calculate the Sample Mean and Sample Size
In cell A33, type “Sample Mean” and use the following formula in cell A34 to calculate the sample mean (x̄):
=AVERAGE(A2:A31)
In cell A35, type “Sample Size” and enter the value 30 in cell A36 (or you can use the COUNT function to count the number of scores).
Step 3: Calculate the Z-Test Statistic
In cell A38, type “Z Test Statistic”. In cell A39, use the following formula to calculate the Z-test statistic:
=(A34-B2)/(C2/SQRT(A36))
This formula calculates the Z-score by subtracting the population mean (B2) from the sample mean (A34), dividing the result by the population standard deviation (C2) divided by the square root of the sample size (A36).
Excel Reverse Order: Simplifying Data Manipulation – projectcubicle
Step 4: Find the Critical Z-Value and Compare
Determine the critical Z-value for your chosen significance level (e.g., α = 0.05 for a two-tailed test, the critical Z-value is approximately ±1.96). This value can be found in Z-tables or using Excel’s NORM.S.INV function for the desired confidence level.
In Excel, to find the critical Z-value for a 95% confidence level, you can use:
=NORM.S.INV(1-0.05/2)
This would be placed in cell B38, for example. The result will be approximately 1.96.
Step 5: Interpret the Results
- If the absolute value of your Z-test statistic (from A39) is greater than the critical Z-value (from B38), you can reject the null hypothesis and conclude that there is a significant difference between the sample mean and the population mean.
- If the absolute value is less than the critical Z-value, you do not reject the null hypothesis, indicating no significant difference.
This simplified example walks you through conducting a Z-test in Excel. Adjust the data, population mean, and standard deviation as needed for your specific analysis.
Troubleshooting Common Z-Test Issues in Excel
Encountering errors or unexpected results is part of the learning process. Ensure your data is correctly formatted, inputs are accurate, and you understand the statistical assumptions underlying the Z-Test.
Conclusion
Mastering the Z-Test in Excel can significantly enhance your data analysis skills, providing you with the ability to conduct meaningful statistical tests on your data. By following this detailed guide, equipped with examples and insights, you’re well on your way to becoming proficient in applying the Z-Test in Excel for your statistical analysis needs.
Dear Reader,
In our journey through the intricate world of data analysis in Excel, from unraveling the complexities of Z-tests to demystifying p-values, we’ve covered a significant expanse of statistical ground. These tools, as we’ve seen, are not just mathematical functions; they are the lenses through which we can discern patterns, make predictions, and ultimately, drive decision-making processes in businesses, research, and beyond.
As we continue to explore and share insights on project management, risk analysis, and other pivotal topics at projectcubicle.com, your feedback, questions, and experiences are invaluable to us. They not only enrich our community but also inspire us to delve deeper, pushing the boundaries of our content to better serve your needs and curiosities.
We Need Your Support
But to keep this mission thriving, we need more than just intellectual engagement; we need your support. Whether it’s by sharing our articles with peers, contributing your expertise through guest posts, or simply engaging with our content on social media, every action you take helps us grow and continue providing valuable resources.
Your insights and experiences could be the beacon for someone navigating their project management journey. So, we encourage you to share, comment, and connect. Let’s build a community that not only seeks knowledge but also supports each other in the quest for excellence.
Stay Connected
Stay tuned to projectcubicle.com for more in-depth articles, tips, and guides. Join us on this journey of continuous learning and improvement. Together, we can tackle the challenges of project management, one solution at a time.
Thank you for your continued support and engagement. Let’s make project management and analysis not just a task, but a triumph.


A dedicated Career Coach, Agile Trainer and certified Senior Portfolio and Project Management Professional and writer holding a bachelor’s degree in Structural Engineering and over 20 years of professional experience in Professional Development / Career Coaching, Portfolio/Program/Project Management, Construction Management, and Business Development. She is the Content Manager of ProjectCubicle.


Thanks for the detailed guide on Z-tests in Excel! Your insights make statistical analysis more accessible.